


Description
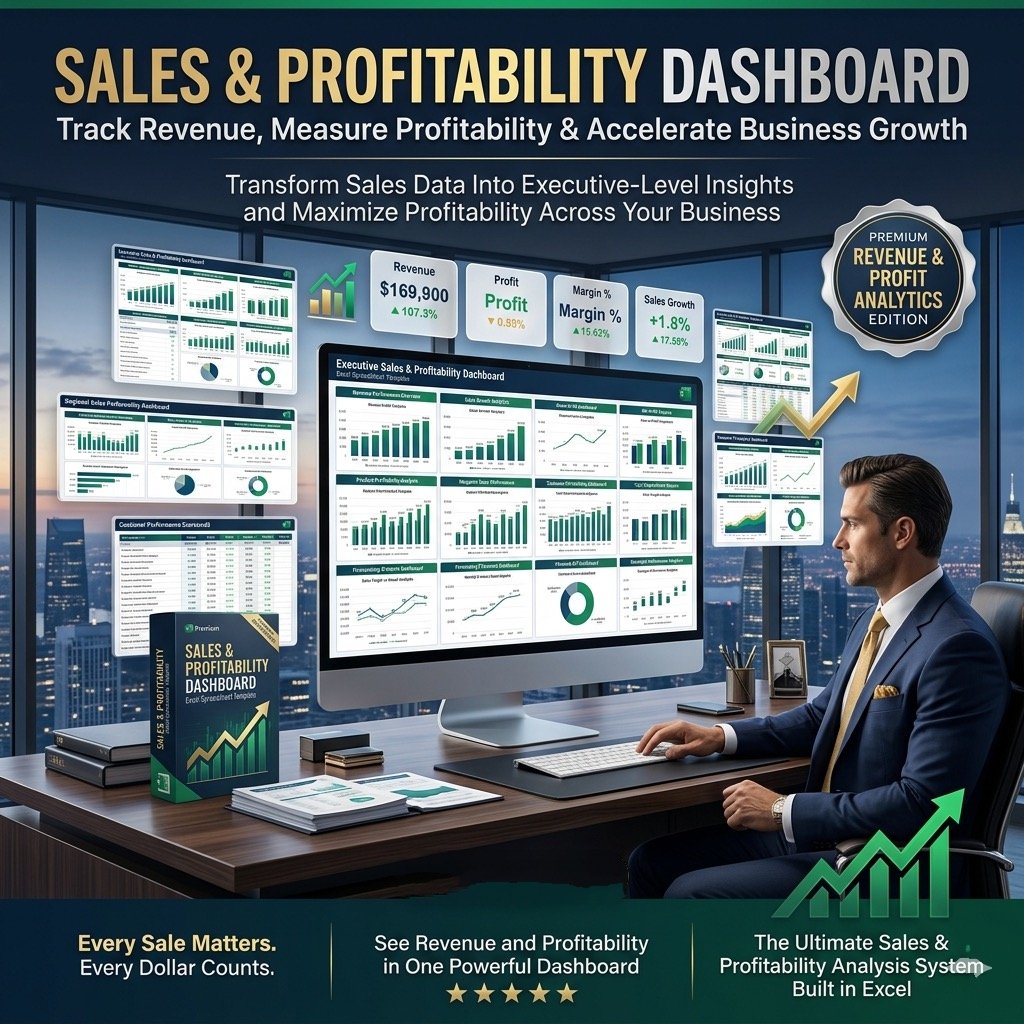
Sales and Profitability Dashboard – Excel Template
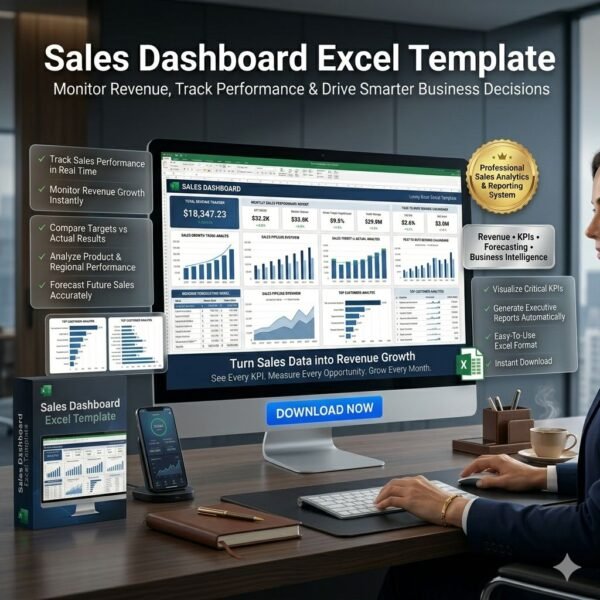
Stay on top of your company’s performance with the Sales and Profitability Dashboard Template in Excel. This professionally designed tool consolidates your key revenue and profitability indicators into one clear, visually engaging view—making it easy to communicate results, track progress, and take action with confidence.
The dashboard gives you both a sales performance overview and a profitability breakdown, helping you understand not just how much you’re selling, but how much profit you’re retaining after costs. It’s the perfect solution for CFOs, finance teams, and business leaders who need accurate insights to drive better decisions.
What You Can Track
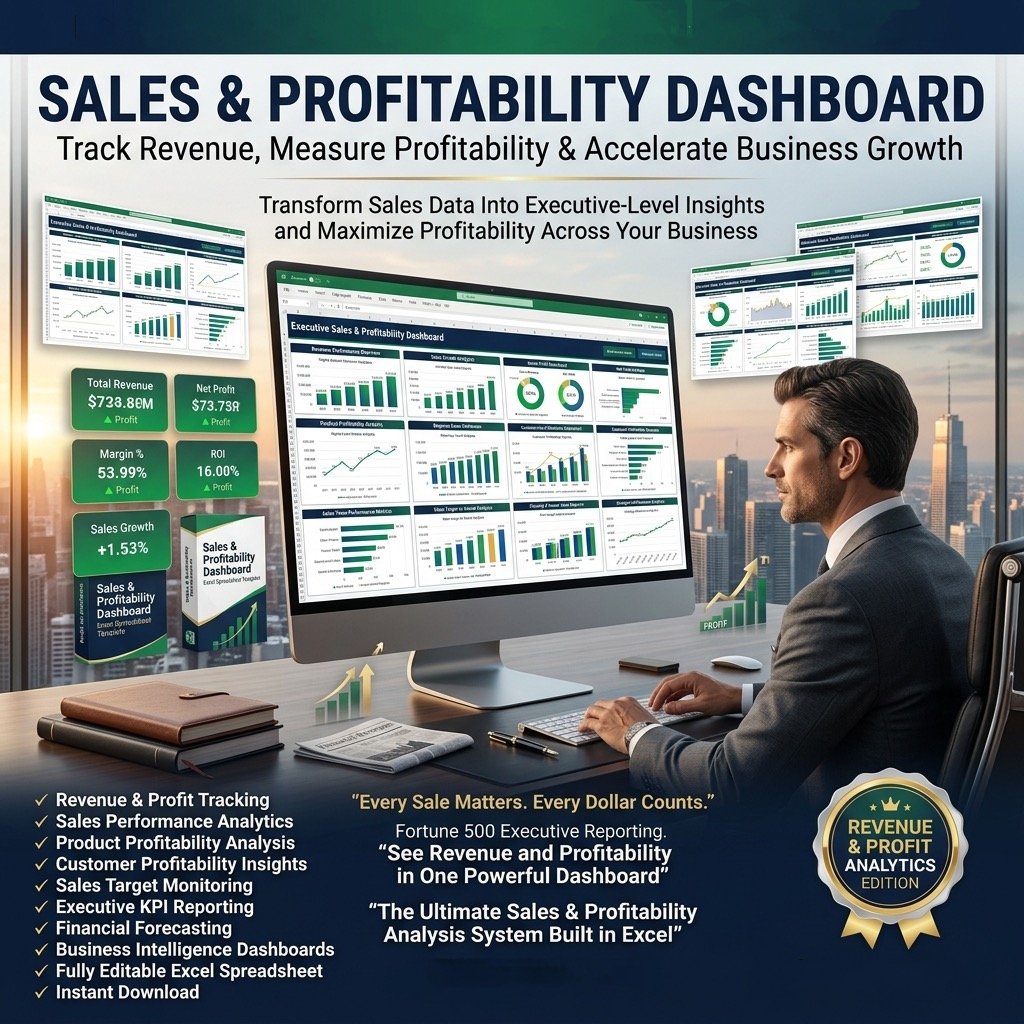
The Sales and Profitability Dashboard covers all major KPIs and metrics, including:
Total Revenue – compare year-to-date revenue against budget and prior year, with monthly performance vs. targets and YoY growth.
Revenue Detail – analyze monthly revenue achievements against budget and growth trends.
Total Profit – monitor year-to-date profits versus budget and previous year, with monthly profit tracking.
Profit Detail – review monthly profitability trends to understand fluctuations and performance gaps.
Product-Level Insights – assess product volume, revenue, and profitability with budget comparisons and growth rates.
Key Features of the Template
Provides comprehensive financial insights for sales and profitability in one dashboard.
Fully editable and customizable – replace sample data with your own.
Professional, eye-catching design that’s easy to interpret.
Spreadsheets are ready for printing (without branding).
No monthly fees, no VBA, no macros, no installation required.
Immediate download – ready to use right away.
What’s Included
Sales & Profitability Dashboard template (Excel).
A text file containing the password to view and edit formulas.
A step-by-step guide to unlock and customize dashboard elements.
Professional Support
Video tutorial for navigating and using the template.
Expert service available to customize the dashboard for your specific business needs.
Post-purchase help and support.
Secure payment options via Stripe and PayPal (no PayPal account required).
Quick Start Guide
Open the dashboard template.
In the Indicators menu, set your fiscal year start month.
Go to the Enter Data menu – replace sample data with your actual data (formula cells are protected).
Explore the Monthly Dashboard to see month-by-month performance.
Use the YTD Dashboard to review year-to-date performance.
Print professional reports instantly with CTRL+P.
✅ With the Sales and Profitability Dashboard, you get a powerful, easy-to-use tool to monitor revenue, measure profitability, and present insights that inspire smarter business decisions.


Reviews
There are no reviews yet.