


Description
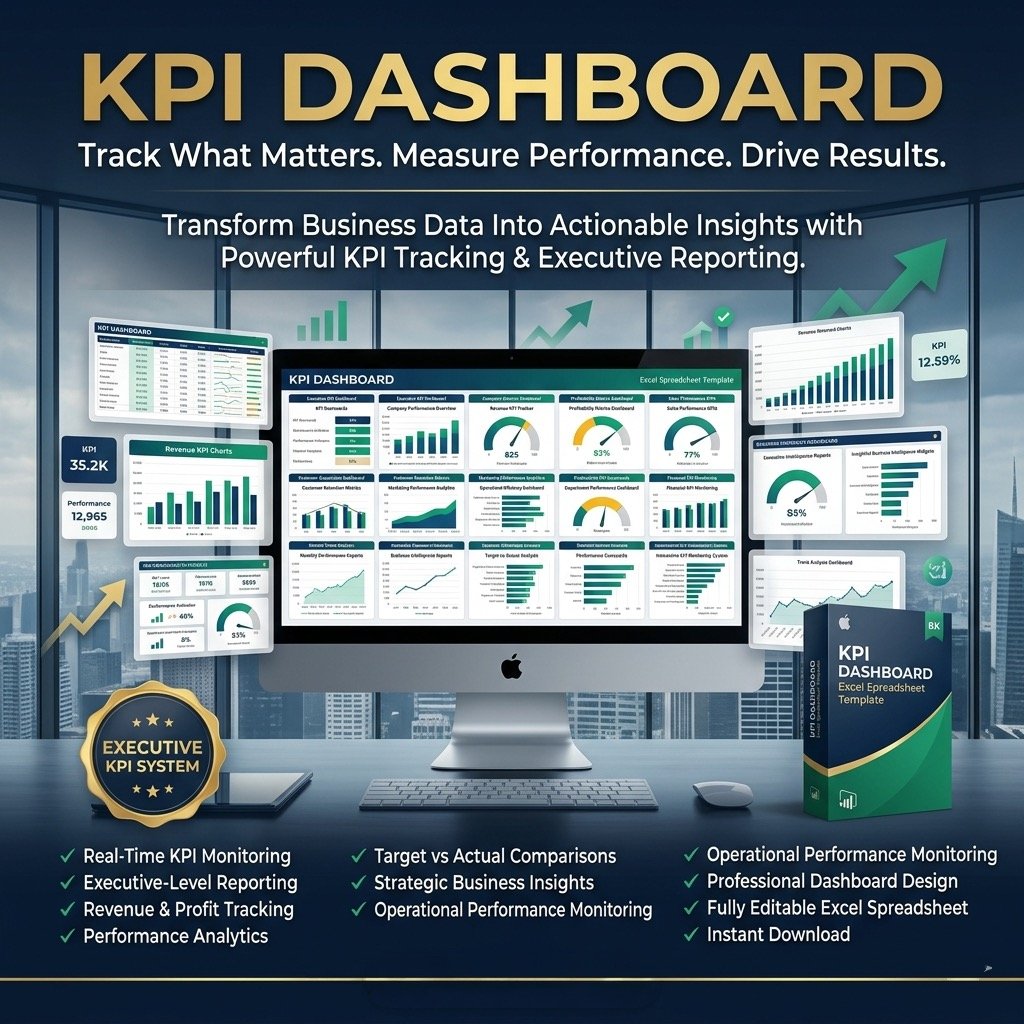
KPI Dashboard Excel Template
Take control of your business performance with the KPI Dashboard Excel Template — a powerful, fully editable tool designed to track your company’s 12 most important Key Performance Indicators (KPIs) in one organized, easy-to-understand dashboard.
This Excel-based template helps you transform raw data into actionable insights. With its clean 3-color visuals, you can instantly spot trends, compare results against targets, and present professional reports that impress stakeholders and management alike.
Why You’ll Love This Dashboard
Managing performance doesn’t have to be complicated. The KPI Dashboard Excel Template consolidates your most critical metrics into one intuitive view—helping you make smarter, data-driven decisions for your department or entire organization.
Key Metrics Tracked
The dashboard covers the most vital business indicators, including:
Revenue: Monthly and year-to-date totals vs. targets and previous periods.
Gross Profit Ratio: Evaluate profitability trends against goals.
Employee Expense: Track total employee-related costs across time periods.
Operating Expense Ratio: Measure operational efficiency month-over-month.
Operating & Net Profit Ratios: Assess financial performance and growth.
Finance Expense: Monitor your total finance-related expenditures.
Inventory & Accounts Receivable: Keep tabs on asset management and liquidity.
Operating Cash Flow: Evaluate cash generation from operations.
Inventory Holding Days: Track how efficiently stock is managed.
Days Sales Outstanding (DSO): Analyze receivable collection speed.
Key Features
✅ Comprehensive Financial Insights – Get a 360° view of your business KPIs in one place.
✅ Beautiful, Professional Design – Eye-catching visuals that enhance reports and presentations.
✅ Fully Editable & Easy to Use – Replace the sample data with your own in minutes.
✅ Supports Up to 12 Indicators – Tailor the dashboard to your business’s key performance needs.
✅ No Monthly Fees or Subscriptions – One-time purchase with lifetime access.
✅ No Macros or Installation Required – 100% Excel-based, simple, and secure.
✅ Print-Ready Layout – Optimized for professional printing, free of logos or watermarks.
✅ Instant Download – Access your file immediately after purchase.
What’s Included
KPI Dashboard Excel Template (ready to use)
Password file to unlock and view formulas
User guide explaining how to edit and customize your dashboard
Video tutorial for easy navigation and setup
Professional customer support for post-purchase help or customization requests
All payments are securely processed through Stripe and PayPal (no account required).
How to Use
Open the dashboard template.
Go to the ‘Indicators’ tab and select your fiscal year start month (e.g., January, July, etc.).
In the ‘Enter Data’ section, replace the sample figures with your actual business data.
Use the ‘Monthly Dashboard’ and ‘YTD Dashboard’ tabs to instantly visualise your results.
Print or share reports directly—simply press CTRL + P.
Note: The template is password-protected to safeguard key formulas and prevent accidental edits. Your password will be included upon purchase.
Make Smarter Decisions, Faster
The KPI Dashboard Excel Template gives your finance team and management a reliable, visual way to monitor performance, spot opportunities, and stay aligned with your business goals.
✔ Easy to use.
✔ Professionally designed.
✔ Built to elevate your reporting and decision-making.


Reviews
There are no reviews yet.