


Description
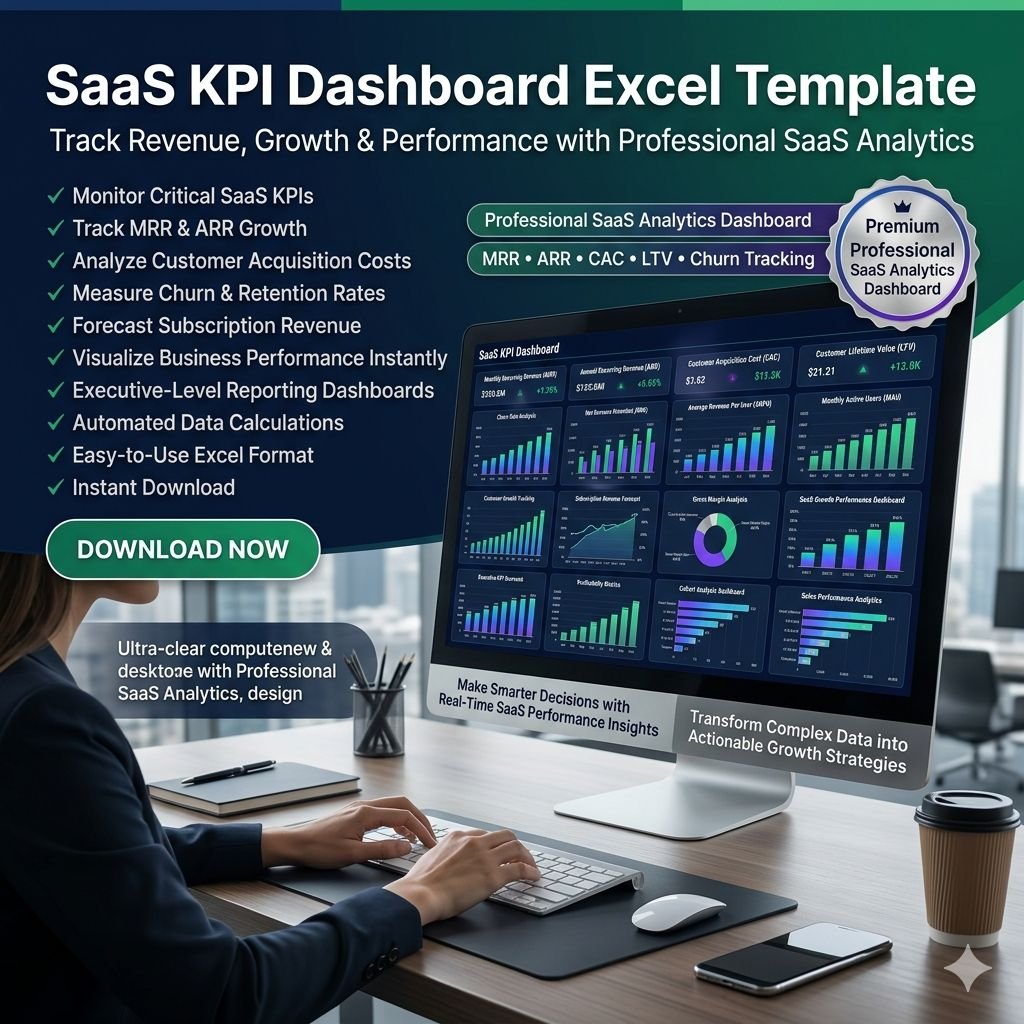
SaaS KPI Dashboard – Excel Template
Running a SaaS business means keeping track of dozens of metrics that determine growth, profitability, and customer success. Our SaaS KPI Dashboard Excel Template simplifies this process by transforming raw data into clear, actionable insights. With a clean design and automated reporting, you can easily monitor performance, spot trends, and make smarter business decisions.

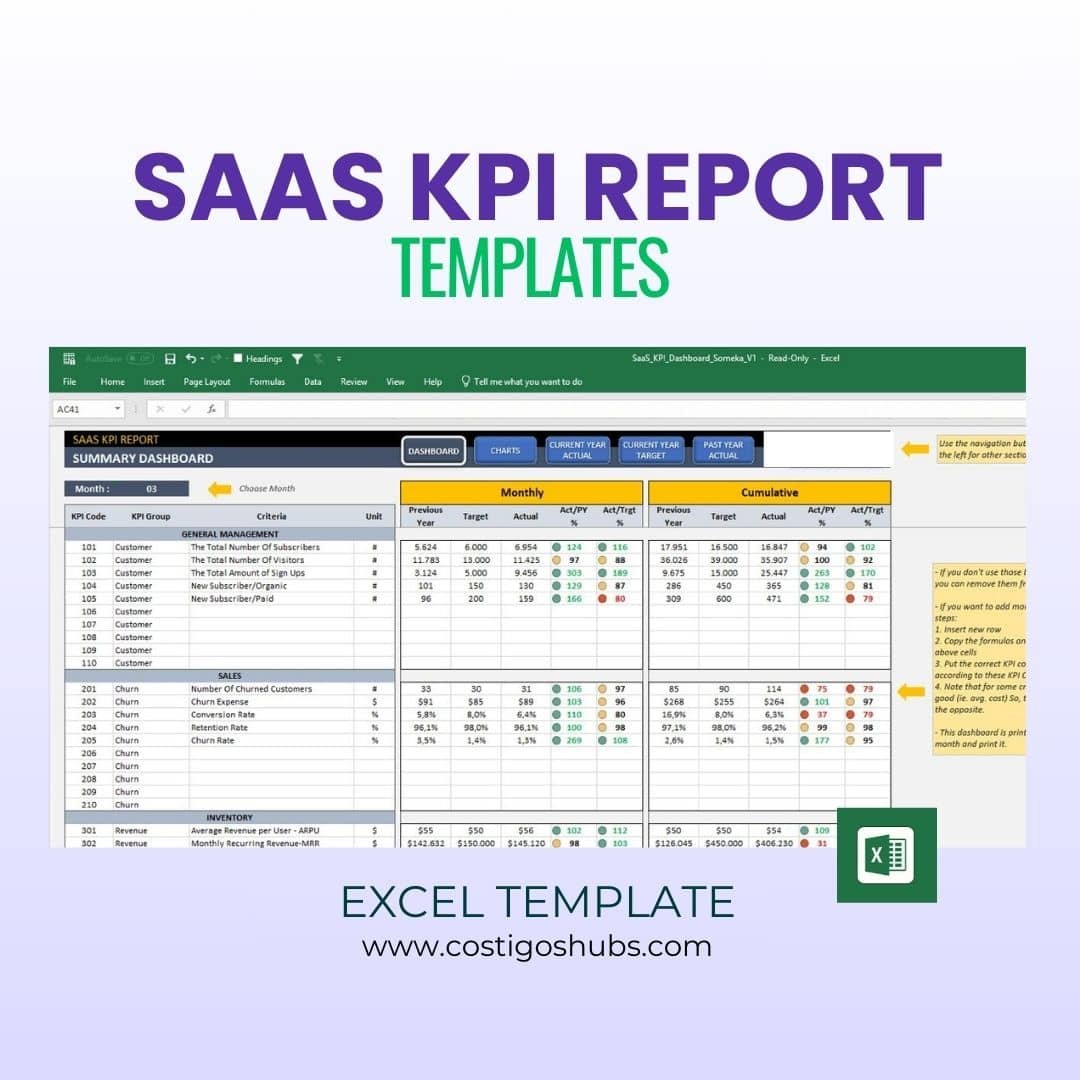
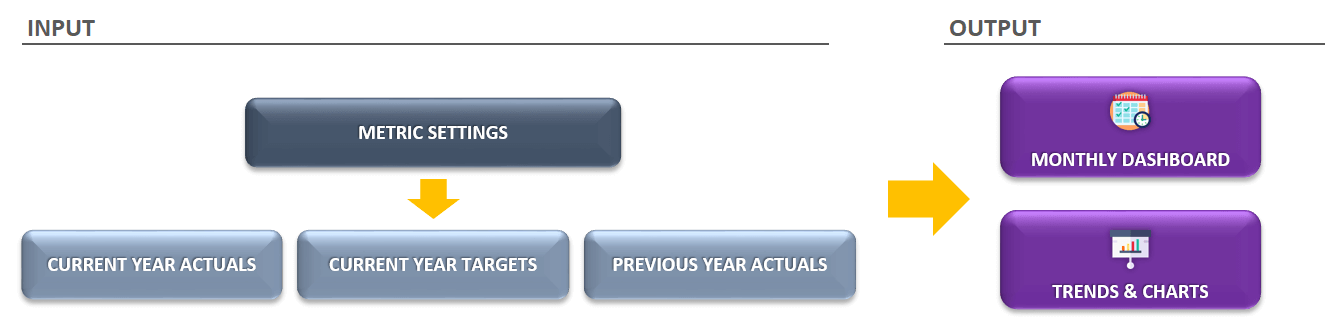
On the Dashboard, you will input the values Current Year Actual, Current Year Target, and Past Year Actual you would like to demonstrate. In this regards the navigation buttons are designed to make it easier to switch between other sections.
If you would like to add your own data or add a new row with a new Saas KPI code, simply delete all dummy information we used for the sample.
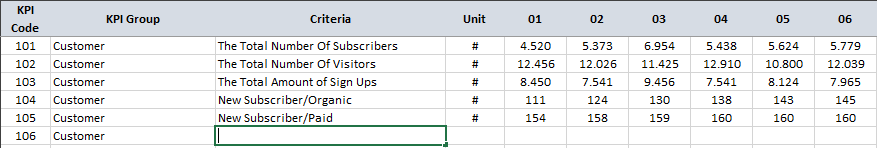
Warning!: Do not forget to change other sections when you add/remove a KPI code. For example, if you add a new KPI to CY Actual section, you should also change it in CY Target, PY Actual, and Cumulative.
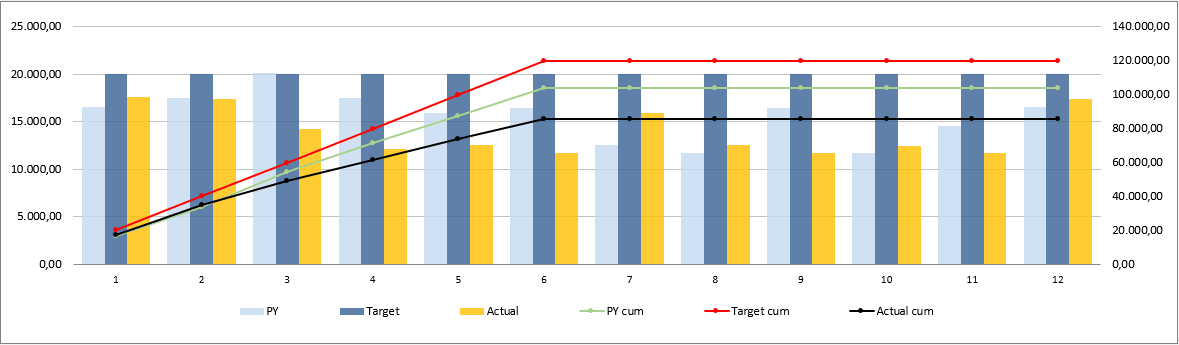
Trends forming with the charts will allow you to understand how your key SaaS metrics perform by giving visuals. You can select one of the SaaS KPIs you need to see.
Why This Dashboard Matters
In today’s competitive SaaS industry, understanding your KPIs (Key Performance Indicators) and OKRs (Objectives & Key Results) is crucial. This template is designed to give you measurable, precise insights into how your business is performing—helping you identify what’s working, what needs improvement, and where to focus next.
We’ve included the 23 most important SaaS KPIs, grouped into five key categories every software company should monitor:
Customer Metrics – subscribers, visitors, sign-ups, conversion rates
Churn & Retention – churn rate, retention rate, churn costs
Revenue – MRR, ARPU, customer lifetime value, net new MRR
Costs – CAC, payroll, COGS, advertising spend
Management & Engagement – NPS, support tickets, gross margin
Key Features
Ready-to-Use Dashboard: Input your data for Current Year Actual, Current Year Target, and Past Year Actual to track progress instantly.
Interactive Charts: Visualise performance trends, compare targets vs. actuals, and present results with clarity.
Flexible KPI Management: Add or adjust KPIs as needed to reflect your unique business model.
Monthly & Cumulative Analysis: Gain both short-term and long-term perspectives for better decision-making.
User-Friendly Navigation: Built-in buttons make it easy to switch between sections and reports.
Professional & Presentable: Clean design ideal for management reports and investor presentations.
Benefits for Your SaaS Business
Save Time: Automates calculations and chart creation so you can focus on strategy, not spreadsheets.
Stay Aligned: Compare actuals vs. targets to measure progress toward company goals.
Improve Decision-Making: Quickly identify growth opportunities and areas needing attention.
Track What Matters: From churn rate to revenue growth, all essential SaaS metrics are in one place.
Fully Customizable: Adjust KPIs, add data, or tailor visuals to your business needs.
Product Summary
Monthly and cumulative SaaS KPI analysis
Target vs. Past Year comparisons
Interactive charts and clean design
Compatible with Excel 2010+ (Windows & Mac)
No installation required – ready to use instantly
Print-ready for reports and presentations
White-label template (no macros/VBA)
Make smarter, data-driven decisions for your SaaS business.
With the SaaS KPI Dashboard Excel Template, you’ll have all the key insights you need—organised, automated, and ready to present.


Reviews
There are no reviews yet.