Description
The Discounted Cash Flow (DCF) is a valuation method that estimates today’s value of the future cash flows taking into account the time value of money. Our Discounted Cash Flow template in Excel will help you to determine the value of the investment and calculate how much it will be in the future.
In brief, the time value of money concept assumes that one dollar in the future is worth less than today’s dollar. Because the reason you should invest today’s dollar is to bring in more value.

In fact, you can use the same concept to value equity investments or a company as a whole. It applies to assess both financial investments (purchasing equity or debt securities) and business investments.
What is Discounted Cash Flow Valuation?
Before our Discounted Cash Flow Excel Template, let’s look at the DCF model.
Discounted cash flow valuation involves two steps:
- Making projections of how much money a company will generate in the future
- Discounting projected future cash flows
If the present value of the investment is less than the cost paid, or to be paid by the investor, the investor is better off. It is because he or she obtains an opportunity to make more money than spends. Of course, the usefulness of this assessment depends heavily on how accurate its outcome is.
Here we face two problems:
- How to accurately predict future cash flows
- What interest rate should we use to discount projected cash flows
Discounted Cash Flow Template Features:
Discounting rate must reflect the opportunity cost for an investor, in other words, should he or she decide to put his or her money elsewhere. However, the problem is that there exists a wide range of investment opportunities, with dramatically different return rates.
Assume that the relevant return rate must reflect the risk level associated with an investment. The more risk an investment involves, the higher the interest rate it has to provide.
The weighted average cost is generally used in place of the discount rate when a company evaluates its value. A commonly accepted convention is that the company’s weighted cost of capital (WACC) already takes into account the risk level associated with the company’s business.
WACC – Weighted Average Cost of Capital
The Discounted Cash Flow Excel template calculates WACC using the historical financial data, as well as Capital Asset Pricing Model.
Most companies finance their operations using various mixes of equity and debt. While it is quite straightforward to calculate the cost of debt, it is not so for the equity part, because, unlike debt, equity does not have an explicitly associated cost.
If a company pays its shareholders dividends on a regular basis, you can calculate the cost of equity by dividing dividends by the equity value. However, dividend policies are not consistent across companies, and some companies do not pay dividends at all. In such cases, the only available option for estimating the cost of equity is using the Capital Asset Pricing Model (CAPM).

Our Discounted Cash Flow Model tool in Excel allows you to select two different methods.
In the WACC section, select Equity Cost Calculation Method in the Assumptions sub-section, as provided above. Please enter the applicable income tax rate. It will have an effect on both WACC and free cash flow calculations, thus on enterprise value.
What are the CAPM Variables?
If you chose using CAPM in this discounted cash flow template, you need to enter the parameters of the model:

Fill in historical data for Equity Value, Dividends, Market Value of Debt, and Interest Expenses. This DCF Template will calculate the After-Tax Cost of Debt by dividing Interest Expenses by the Market Value of Debt, less the tax effect of the cost of debt.
According to your method, this Discounted Cash Flow Excel tool can calculate the Cost of Equity by dividing Dividends by the Market Value of Equity or using CAPM. WACC is equal to the average cost of equity and debt, weighted on equity and debt market values respectively.

You can override calculated interest rates with manually entered User-Defined Rates. Then you can go to the Cash Flow section.
Cash Flow
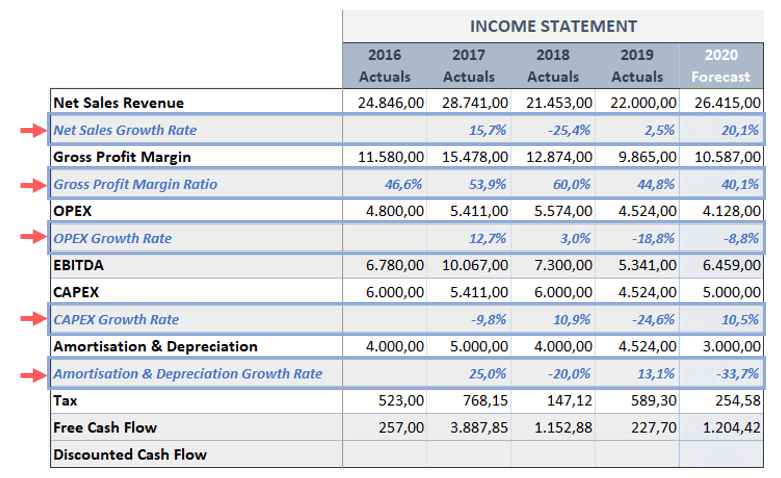
Firstly, input the historical financials (from the income statement) along with forecasted figures for the current year. You must enter at least three sequential years of data, including the most recent forecast. You can use the blue written parameters to predict future cash flows.
In this Excel tool, the Cash Flow Projection parameters calculate automatically, but you can enter any parameter value manually. Unless you enter User-Defined Value, the mean value will be used in the projected future cash flows.
 In addition, the present value of expected cash flows for the next 10 years shows up by applying WACC. The terminal value represents the present value of cash flows beyond the 10-year period.
To arrive at a market capitalization of the company, the calculated present value of future cash flows (enterprise value) is adjusted for an outstanding debt and cash on hand (manually entered). Lastly, dividing the market capitalization by the number of outstanding shares will give you an estimated share price.
Discounted Cash Flow Excel Template Features Summary:
- Making a projection for your future value of money
- DCF Template in Excel
- Informational notes
- No installation needed, ready to use
- Works both on Mac and Windows
- Compatible with Excel 2010 and later versions
- Does not include any VBA code or macros


Reviews
There are no reviews yet.